“Cash earnings are lower this quarter and flat on the prior comparative period (pcp), with stronger income offset by higher expenses. Net interest income was higher than pcp benefiting from higher net interest margin (NIM).
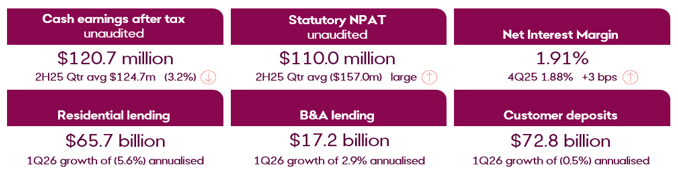
Deposit mix improved over the quarter, with lower cost deposits growth of 3.4% annualised now representing 53.0% of customer deposits, while term deposits reduced to 34.7% of customer deposits. Residential loan balances contracted 5.6% annualised over the quarter, representing our cautious approach to competitive dynamics in third party channels. The balance sheet remains well positioned for a return to growth in the second half of the financial year.
During the quarter, we delivered several strategic milestones which will position the bank for sustainable growth in the second half of this financial year and beyond. The Bendigo Lending Platform has been successfully rolled out across the branch network in all states, except for Victoria and Tasmania which will be rolled out in November. Bendigo’s refreshed in-app onboarding process went live at the end of October, with positive feedback on the experience including the ability to onboard new customers in a matter of minutes”.
Richard Fennell, Managing Director and CEO
Financial Performance for 1Q26
- Unaudited cash earnings of $120.7 million, down 3.2% on 2H25 quarterly average. Unaudited statutory NPAT of $110.0 million in the quarter.
- NIM was 1.91%, up 3bps on 4Q25, with the benefit of improved deposit mix through growth in savings accounts, term deposit repricing and a more favourable asset mix offsetting the impact of a lower cash rate. The exit NIM was slightly lower than 1Q26 average.
- Net interest income was up 3.4% on 2H25 quarterly average driven by higher NIM.
- Other income was up 6.8%, driven by higher card transaction volumes and seasonality of Community Bank franchise fees.
- Operating expenses were 7.6% higher due to seasonal factors and several one-offs, or 3.0% when adjusted for these items. These include:
- Higher staff costs impacted by higher average quarterly workdays, movement in the value of leave balances and redundancy costs.
- An unplanned additional remediation provision of $3.7 million.
- Credit expenses ($0.3 million reversal for the quarter) benefited from a collective provision release in Agribusiness, partly offset by higher specific provisions in Consumer and Business.
- Balance sheet remains strong with a customer deposit funding ratio of 77%, a quarterly average LCR of 136.5%, and spot NSFR of 117.7%. The CET1 ratio was 10.93%, down 7 bps on the prior quarter.
Financial Summary for 1Q26
| Change (%) | |||||
| Group Financial Results ($m) | 1Q26 | 2H25 Qtr Avg. | 1Q25 | 2H25 Qtr Avg. | 1Q25 |
| Net Interest Income | 436.2 | 422.0 | 414.4 | 3.4% | 5.3% |
| Other Income | 69.6 | 65.1 | 69.4 | 6.8% | 0.2% |
| Total income | 505.8 | 487.1 | 483.8 | 3.8% | 4.5% |
| BAU Expenses | (299.1) | (272.6) | (280.1) | (9.7%) | (6.8%) |
| Investment Spend | (29.7) | (32.9) | (27.0) | 10.0% | (9.7%) |
| Operation Expenses | (328.8) | (305.5) | (307.1) | (7.6%) | (7.1%) |
| Operating performance | 177.0 | 181.6 | 176.7 | (2.5%) | 0.2% |
| Credit reversals | 0.3 | 2.1 | 1.0 | (Large) | (Large) |
| Cash earnings (after tax) | 120.7 | 124.7 | 120.8 | (3.2%) | (0.0%) |
| Non-cash items (after tax) | (10.7) | (281.7) | (17.6) | Large | 38.7% |
| Statutory net profit (after tax) | 110.0 | (157.0) | 103.2 | Large | 6.6% |
Approved for release by:
The Bendigo and Adelaide Bank Board


Related Articles
-
3Q25 trading update
Quarterly trading updates will now be included in the BEN reporting cadence, released Q1 and Q3 of the financial year.